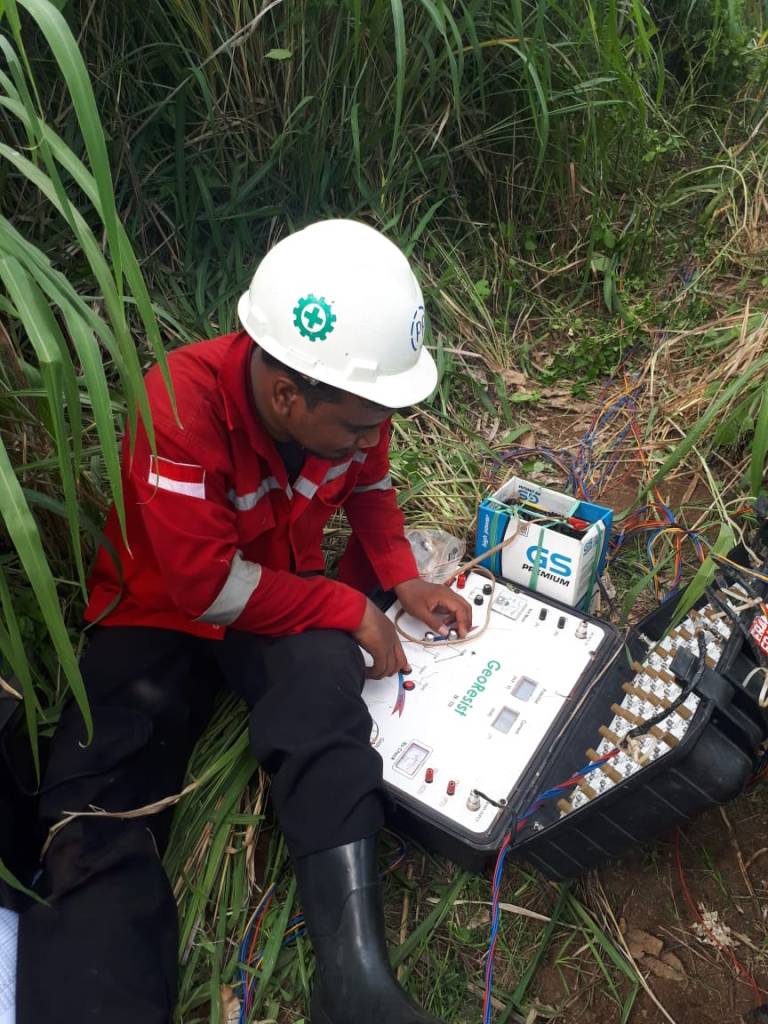
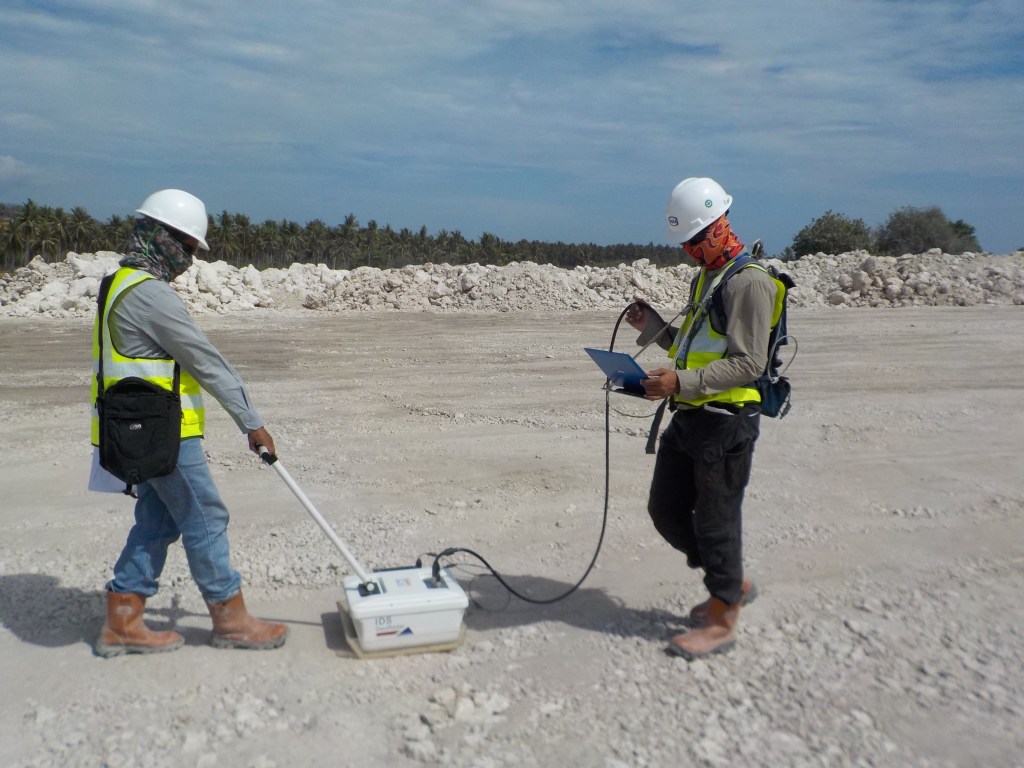
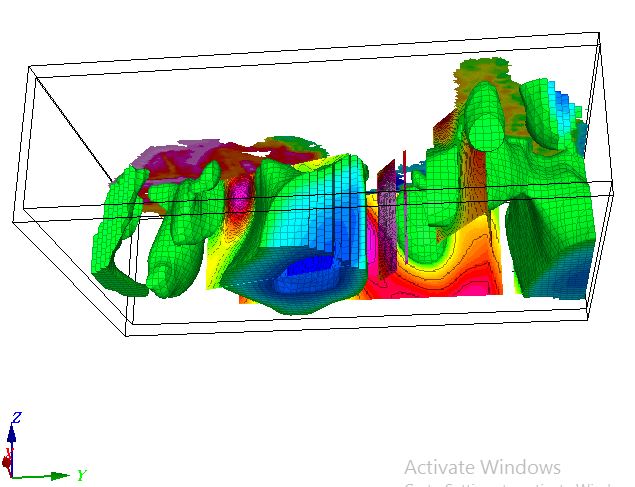
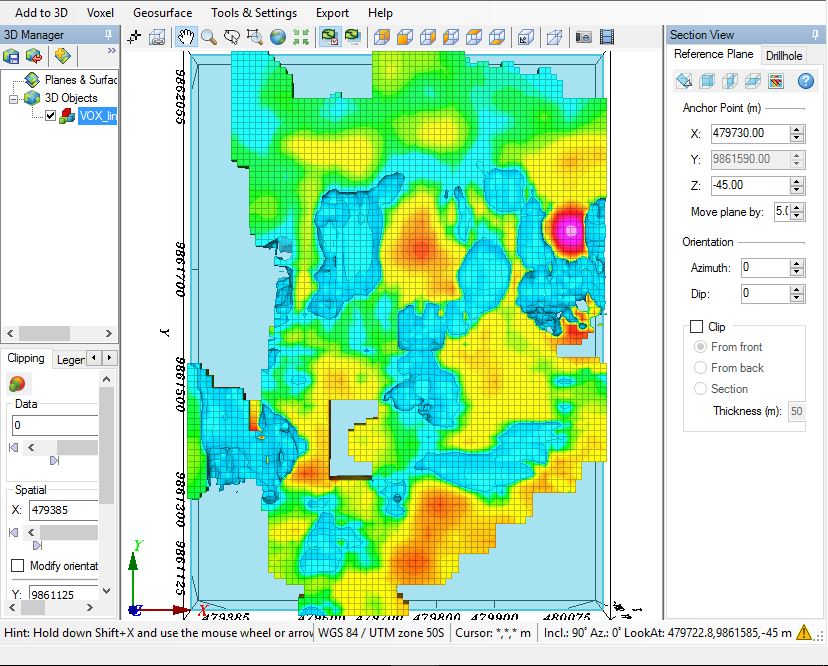
metode geolistrik membantu menginvestigasi adanya sumber mata air, air permukaan ataupun akuifer yang ketiganya mempunyai ciri khas baik dalam karakter strukturnya atau lokasi keberadaanya.
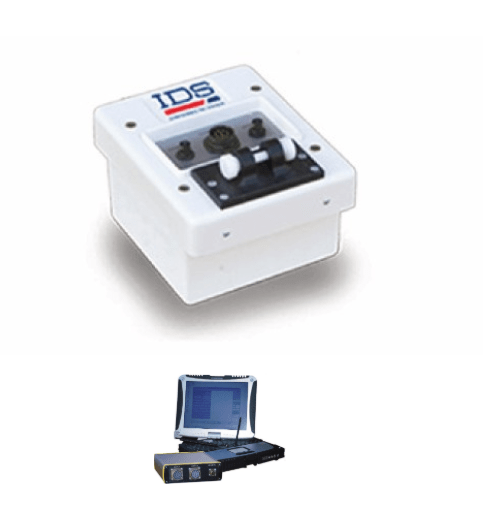
Alat yang digunakan menggunakan alat single channel dengan dibuatkan switchbox sehingga bisa dilakukan pengukuran 2-D. Injeksi arus listriknya dilakukan secara manual tetapi akurasinya tidak jauh berbeda jika alatnya rutin di kalibrasi dengan alat-alat yang lebih bagus sensitifitasnya. Sebelum dilakukan pengukuran dilakukan terlebih dahulu survey tinjau untuk melihat struktur, pola sedimentasi dan topografinya sehingga kita bisa mengklasifikasi model air apa yang terkandung di bawah permukaan.
Apparent resistivity, resistance, induced polarization (IP), SP, and battery voltage.
Measurement Range
+/- 10Vp-p.
Measuring Resolution
Max 30 nV—depends on voltage level.
Screen Resolution
4 digits in engineering notation.
Transmitter
200W internal transmitter. 5kW, 10kW and 15kW external transmitters also available (see separate brochure).
Output Current
1 – 2000 mA continuous, measured to high accuracy.
Output Voltage
800 Vp-p—actual electrode voltage depends on transmitted current and ground resistivity.
Input Channels
Five models available—8-, 6-, 4-, 2-, or 1-channel.
Input Gain Ranging
Automatic—always uses full dynamic range of receiver.
Input Impedance
>150 MOhm.
SP Compensation
Automatic cancellation of SP voltages during resistivity measurement. Constant and linearly varying SP cancels completely (V/I and IP measurements).
Type Of IP Measurement
Time domain chargeability (M). Six time slots measured and stored in memory.
IP Current Transmission
ON+, OFF, ON-, OFF.
IP Cycle Times
0.5, 1, 2, 4, and 8 s.
Measure Cycles
Running average of measurement displayed after each cycle. Automatic cycle stops when reading errors fall below user set limit or user set max cycles are done.
Resistivity Cycle Times
Basic measure time is 0.2, 0.4, 0.8, 1.2, 3.6, 7.2, or 14.4 s as selected by user via keyboard. Autoranging and commutation adds about 1.4 s.
Signal Processing
Continuous averaging after each complete cycle. Noise errors calculated and displayed as percentage of reading. Reading displayed as resistance (dV/I) and apparent resistivity (ohmm or ohmft). Resistivity is calculated using user-entered electrode distances.
Noise Suppression
Better than 100 dB at f >20 Hz.Better than 120 dB at power line frequencies (16 2/3, 20, 50, and 60 Hz) for measurement cycles of 1.2 s and above.
Total Accuracy
Better than 1% of reading in most cases (lab measurements). Field measurement accuracy depends on ground noise and resistivity.Instrument will calculate and display running estimate of measuring accuracy.
System Calibration
Calibration is done digitally by the microprocessor based on correction values stored in memory.
Supported Configurations
In manual mode: Resistance, Schlumberger, Wenner, dipole-dipole, pole-dipole, and pole-pole.In automatic mode: Any configuration can be programmed via command file.
Operating System
Stored in reprogrammable flash memory. Updated versions can be downloaded from our website and stored in the flash memory.
Data Storage
Full resolution reading average and error are stored along with user-entered coordinates and time of day for each measurement. Storage is effected automatically in a job-oriented file system.
Data Display
Apparent resistivity (ohmmeter), current intensity (mA), and measured voltage (mV) are displayed and stored in memory for each measurement.Data can also be displayed on an Android device in real time as bright color pseudosections, IP curves, transmitter/receiver plot, contact resistance measurements, and more.
Memory Capacity
Virtually unlimited data storage in real time on controlling Android device.The internal SuperSting memory can store more than 79,000 measurements (resistivity mode) and more than 26,000 measurements in combined resistivity/IP mode.
Data Transmission
Data can be instantaneously transferred from the Android device by email or by file transfer from the Android device USB port. RS-232C channel available to dump data from instrument to a Windows-type computer on user command.
Automatic Multi-Electrodes
The SuperSting is designed to run dipole-dipole, pole-dipole, pole-pole, gradient, Wenner, and Schlumberger surveys including roll-along surveys completely automatic with the patented Dual Mode Automatic Multi-Electrode system (U.S. Patent 6,404,203) or a passive electrode cable system. The SuperSting can run any other array by using user-programmed command files. These are ASCII files that can be created using a regular text editor. The command files are uploaded to the SuperSting RAM memory and can at any time be recalled and run as a survey.
User Controls
20-key-tactile, weatherproof keyboard with numeric entry keys and function keys.On/Off switch.Measure button integrated within main keyboard.LCD night-light switch (push to illuminate).Keyboard and LCD are mirrored to an Android™ device using Wi-Fi® technology for easy remote control of the SuperSting.
Display
Graphics LCD display (16 lines x 30 characters) with night-light.Android mobile phone screen (7”) or 10” Android tablet with bright color AMOLED display.
Power Supply, Field
12V or 2x12V DC external power—connector on front panel.Optional AC/DC power supply and motor generator.
Power Supply, Office
DC power supply.
Operating Time
Depends on survey conditions and size of battery used. Internal circuitry in auto-mode adjusts current to save energy.
Operating Temperature
-20 to +50°C when controlled by your Android device (phone or tablet). The instrument LCD screen fades out at -5ºC, but the instrument continues to function normally by your Android phone, kept warm in your pocket
Weight
10.9 kg (24 lbs.).
Dimensions
Width: 184 mm (7.25″).Length: 406 mm (16″).Height: 273 mm (10.75″).
IDS menyediakan peralatan yang terkonfigurasi terhadap permintaan dari pengguna. Jenis radar RIS-K2 Radar Control Unit (DAD – 1CH, DAD – 2CH/MCH or DAD – 4CH/MCH) merupakan suatu terobosan baru dari produk yang ditawarkan dengan perkembangan teknologi radar yang semakin maju. Control Unit ini dapat disambungkan ke antenna IDS berbagai model untuk melihat situasi dangkal hingga dalam di bawah permukaan tanah dengan dilengkapi reolusi tinggi hingga rendah. Pengumpulan data dapat ditunjukkan secara cepat menggunakan software tertentu untuk lebih mencakup peforma yang maksimum. Karakter sistem utamanya adalah mudah dalam penggunaan, dapat di-upgrade, compatible dengan GPS, ukuran kompak, ringan, dan remote assistance.
System
Compatible with all IDS TR Single Antenna
Pulse Repetition Frequency : 400 KHz
Scan Rate : Up to 850 Scans/Sec
Range : Up to 9999 nsec.
Number of samples per scan : 128-8192
Sample size : 16 bit
Resolution : better than 5psec
Stacking : up to 32768 scans, automatic or user selectable
Ports : ANTENNA 1, WHEEL, LAN, BATTERY
Maximum number of connectable antennas : 1
Maximum number channel : 1 channel
Data collection : Survey wheel driven or continuous motion profiling
CE compliant
DAD Mechanical and Operational
Dimension : 17 cm x 22 cm x 5.5 cm
Weight : 1.2 Kg
Power Supply : 12V ± 10%
Water and dust proof (IP 65)
Maximum power consumption (data collection) : 8 W
RADAR ANTENNA
Antenna
Type : Shielded Dipole
Frequency : 600 MHz
Supplied with anchor plate for Antenna drag kit
Relative Humidity
<90% (non condensing)
Rain Proof (IP 65 in request)
Dimension
20 cm x 26 xm x 20 xm
Weight : 3 Kg
RADAR ACCESSORIES
Survey Wheel Kit (WHE50)
Wheel with 17 cm of diameter
Mechanical support for antenna side
Connection cable
Dimension : 11 cm x 6 cm x 3 cm
Weight : 0.9 Kg
Relative humidity : <90% (non-condesing)
Rain Proof IP 65
HIP Chain Encoder (HCE)
For unshielded antennas
Metric walktax distance measurer m/dm
Feet walktax distance measurer feet/inch
Real cotton thread reels, 10-pack
Dimension : 15 cm x 8 cm x 9 cm
Weight : 0.5 Kg
Relative humidity : <90% (non-condensing)
Shipping Box (SHI-BOX)
It contains No.1 DAD, No.1 Antenna, various accessories
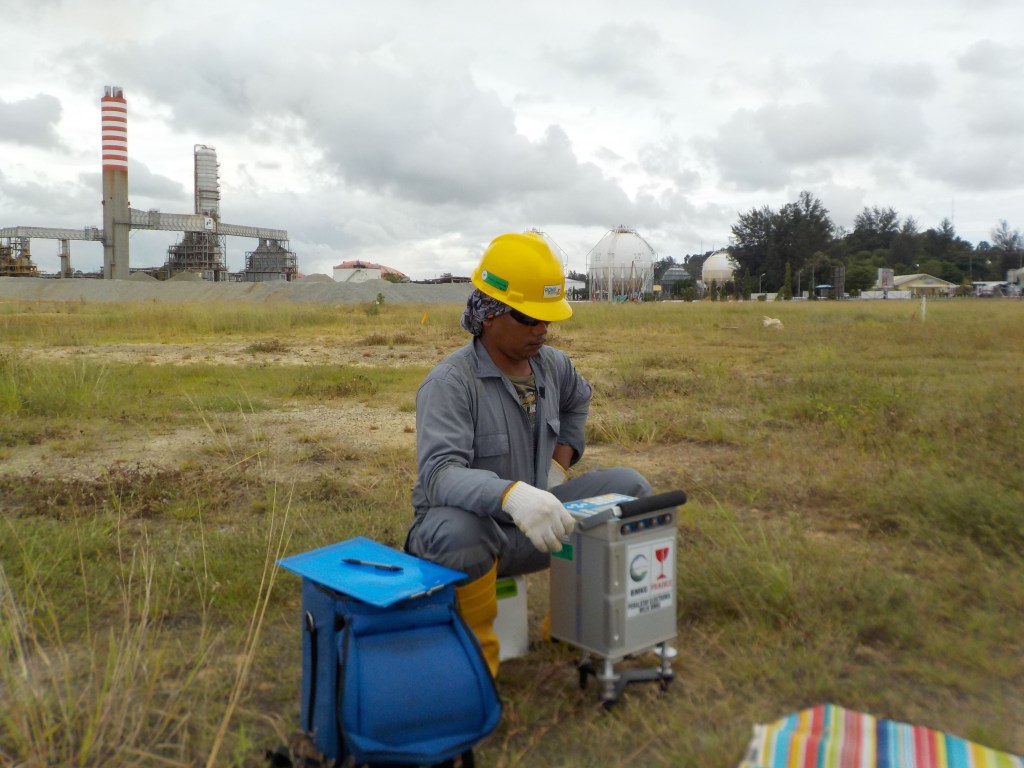
Metode microgravity merupakan metode yang pada dasarnya survey gravity tetapi pelaksanaanya sedikit berbeda seperti spasi antar titik yang relatif rapat, target yang dicari lebih kecil dimensinya dan juga area yang disurvey relatif lebih kecil.
Survey microgravity banyak digunakan dalam pekerjaan kontruksi dan bidang sipil yang bertujuan untuk mengidentifikasi adanya objek-objek bawah permukaan dengan pendekatan nilai densitasnya.
Alat yang digunakan merupakan merk Scintrex dengan spesifikasi yang relatif berbeda dengan alat lain seperti Lacoste Rosberg karena di alat Scintrex sudah terkalibrasi koreksi pasang surut dan drift nya sehingga dalam pengolahan datanya relatif lebih mudah.
Di bidang sipil dan kontruksi erat kaitanya dengan kekerasan dan kekuatan lapisan bawah permukaan atau sedimen dan parameter yang sering dibutuhkan adalah densitas yang berhubungan dengan kekerasan batuan. Untuk mendapatkan nilai densitas ini bisa dilakukan uji lab dari data sampel bor atau pengukuran geofisika seperti survey gaya berat atau metode gravity. Kebutuhan di area kontruksi biasanya tidaklah luas sehingga dibutuhkan cakupan kedalaman yang relatif dangkal dan spasi antar titiknya rapat. Dalam eksplorasi pertambangan dan perminyakan spasi antar titik biasanya lebih dari 500m sedangkan untuk bidang sipil dan kontruksi sekitar 25m atau kurang.
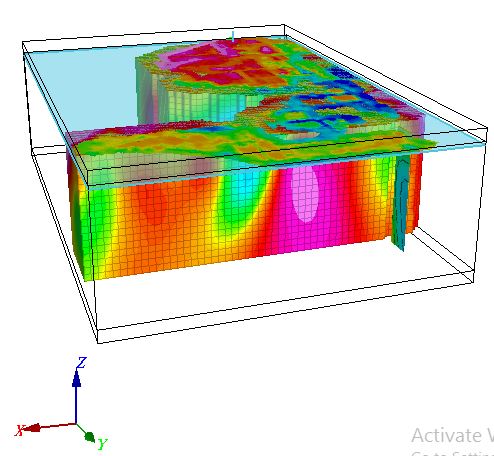
Pemodelan densitas ini didapatkan dari proses inversi yang didapatkan dari anomaly bouguer. Hasil pemodelan densitas ini akan di korelasikan dan digunakan untuk penentuan kerangka model kontruksi seperti pemancangan, pondasi dan lainya.
Dalam dunia eksplorasi gravity banyak digunakan oleh departemen pemerintah atau dan sebagian swasta untuk eksplorasi minyak dan gas bumi. Tujuan utama dari survey gravity yaitu untuk mengetahui topografi atau konfigurasi formasi dan basement, dan lebih lanjut lagi untuk mencari lokasi source rock dan lainya, tetapi didunia kontruksi atau sipil gravity dikembangkan untuk menentukan objek yang lebih kecil dan spasi tiap titik pengukuranya pun semakin rapat yang biasanya sekitar 500m sampai 1000m bahkan lebih tetapi untuk metode microgravity spasinya sekitar 5m, 10m dan lainya yang disesuaikan dengan dimensi target yang di tuju.
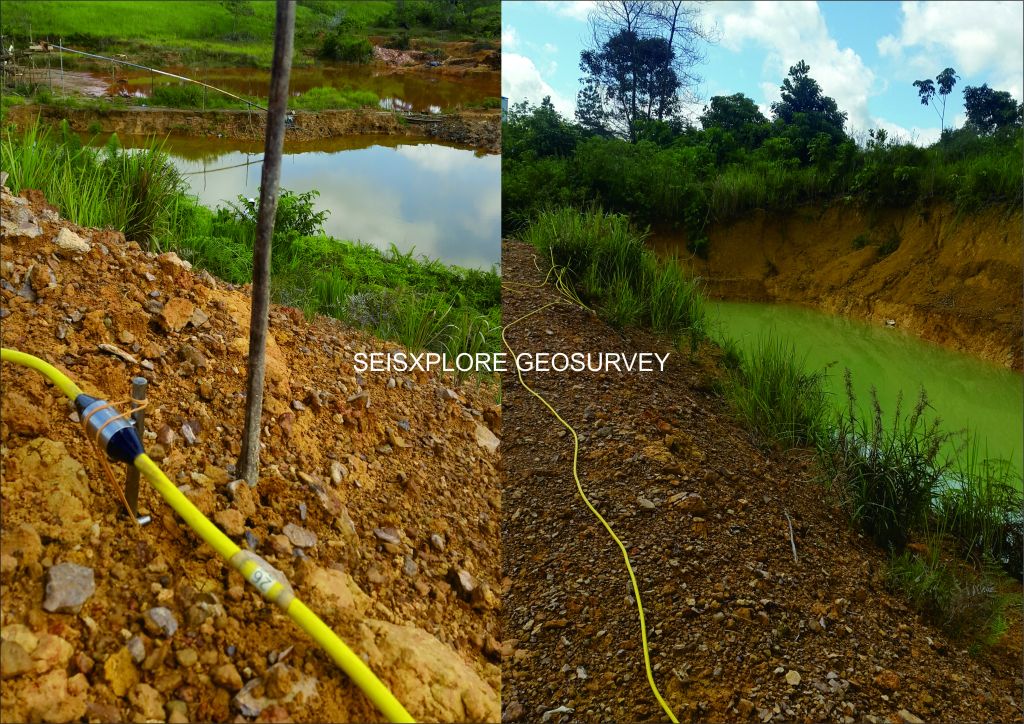
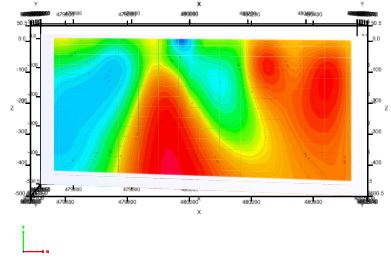
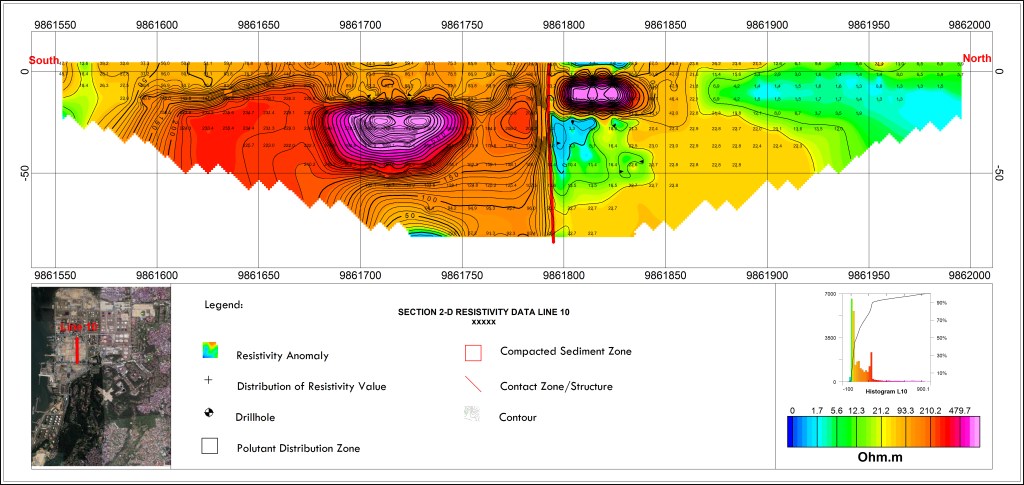
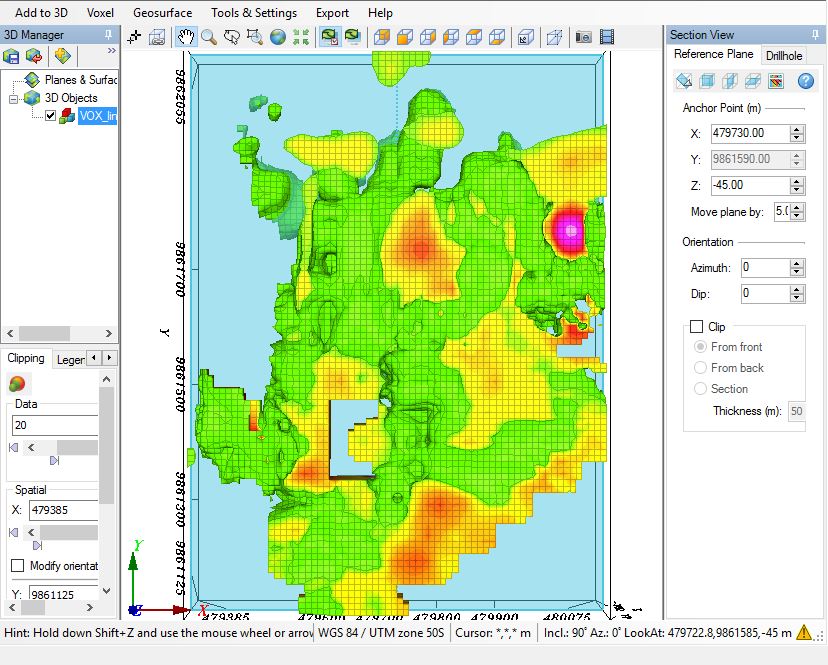
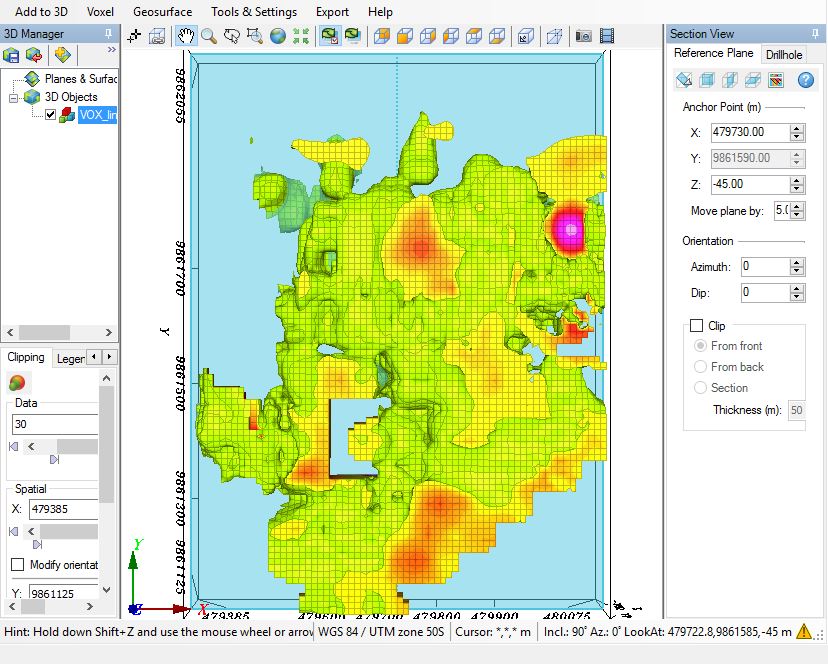
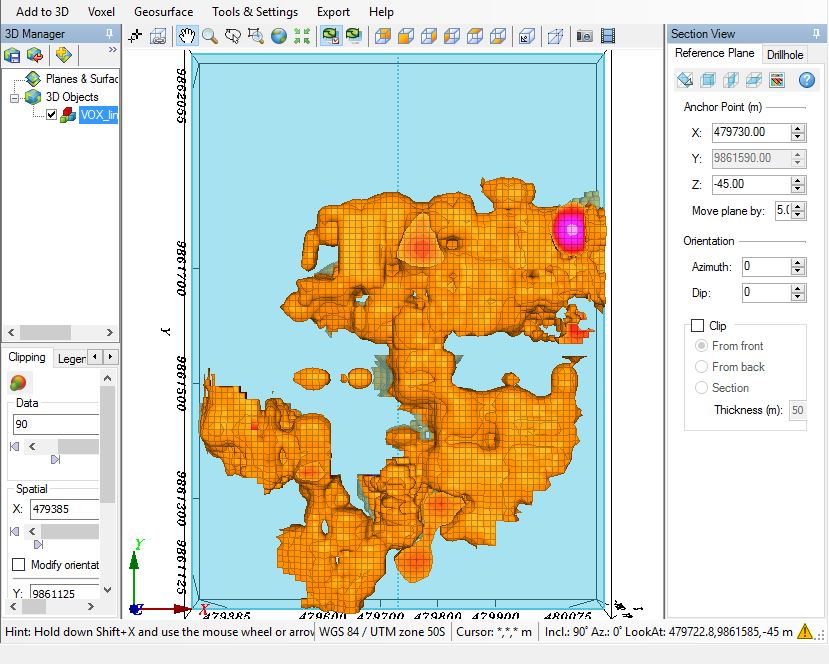
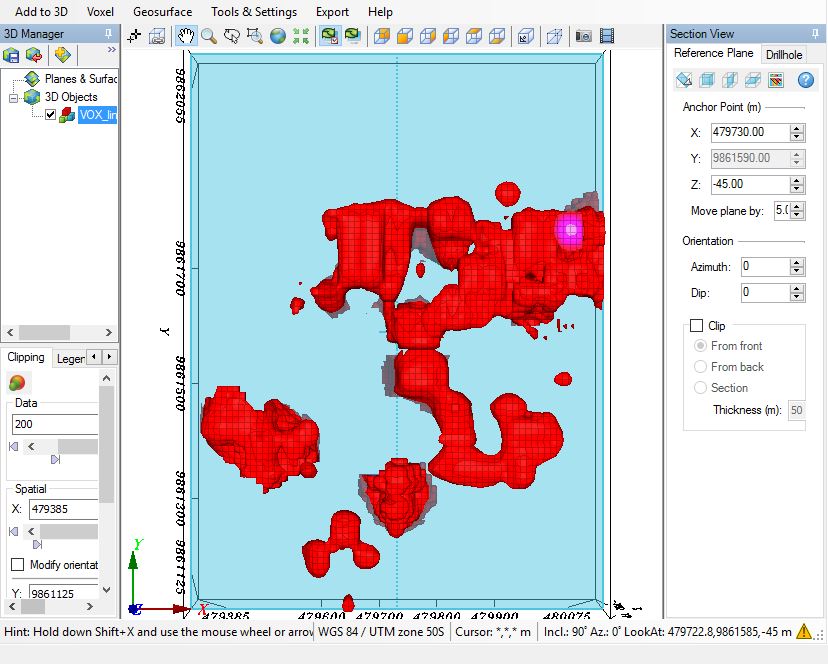
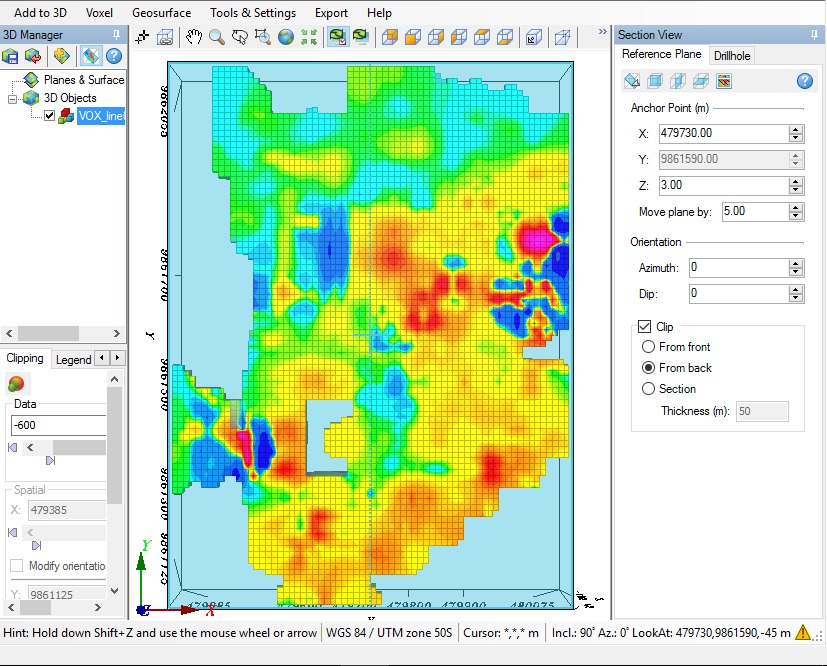
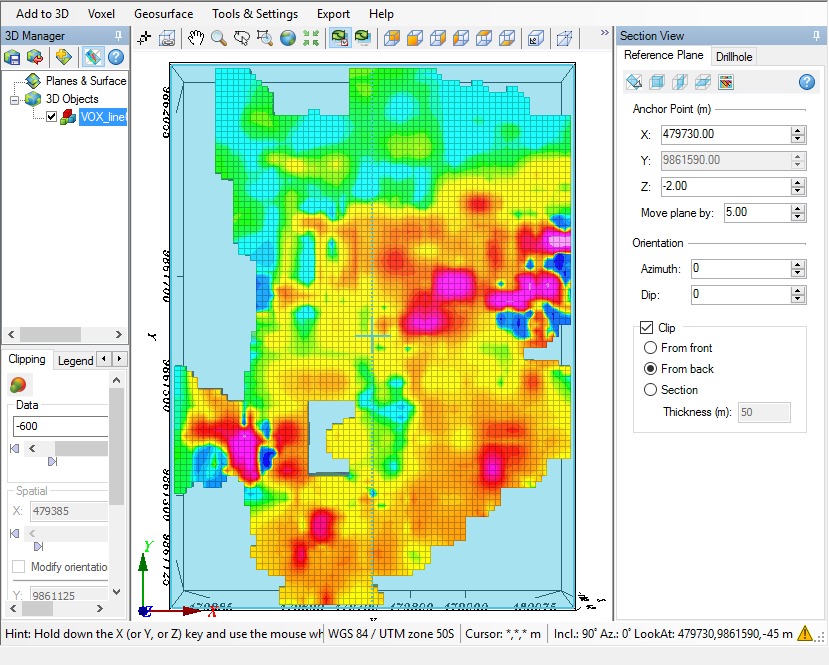
Gambar pertama merupakan hasil pengukuran geolistrik di area yang relatif tidak terkena limbah sedangkan gambar bawah merupakan hasil yang terkontaminasi dengan limbah kimia.
pengukuran geolistrik akan memperlihatkan adanya nilai yang sangat jauh dengan estimasi daerah tersebut merupakan daerah dengan porositas tinggi atau sedimen seperti pasir dan sedimen laut.